

|
|
| Prof. Dr. H. Hinterberger | Index |
| Research areas | Computer -supported Instruction |
| Collection-based research | |
| Multidimensional data structures | |
| Multivariate visualization |
Computer-Supported Instruction
Each student his own tutor
To accommodate large classes and raise the motivation of natural science students
taking an introductory information and communication technology course, we develop
e-learning material, so called E.Tutorials,
based on active, application oriented learning. An analysis of the factors that
contribute to the course's success shows that it is not the technology in various
forms that is responsible but the careful blending of different didactical methods,
based on sound pedagogical principles. This blend, combined with individualized
learning, has led to a remarkable improvement in the student's motivation. They
can apply conceptual knowledge more flexibly and work more independently with
increasing self confidence.
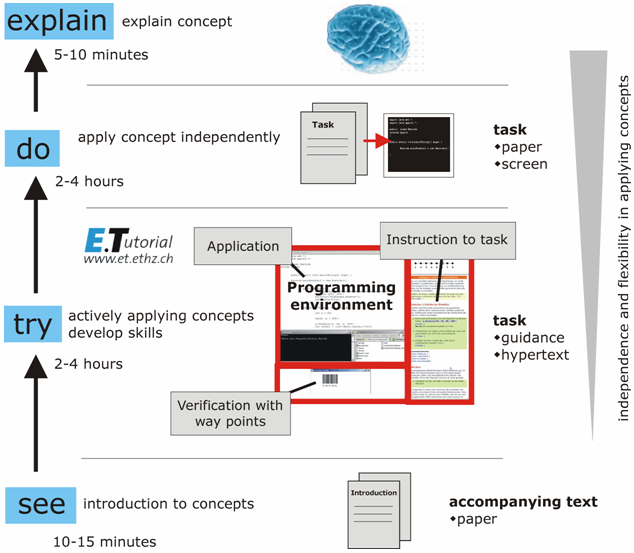
Figure 1
The use of E.Tutorials in a blended learning environment
Electronic assessment
In the early 1970’s researchers on both sides of the Atlantic found that,
unexpectedly, what influenced students most was not the teaching but the assessment.
It has been claimed that students have become more strategic with their use
of time and energies since the 1970’s and more, rather than less, influenced
by the perceived demands of the assessment system in the way they negotiate
their way through their studies.
Therefore it stands to reason that assessment and instruction ought to make demands
at the same conceptual level, if we expect to teach effectively. One of our projects
develops an exam-database with application-oriented tests that match the cognitive
efforts asked for during instruction. The timing of the assessment will be under
the student's control.
Questions from this database will be woven into the application guide (Fig. 1) to provide students with feedback on their progress and to allow complementary presentations of teaching material. Electronic assessments facilitate quality control through automatic analysis of an exam question’s structure, the mix of test questions and individual exam results.
![]()
Swiss Food Composition Database
Information on the nutritional composition of foods is essential for the quantitative
study of human nutrition, its application in the treatment and management of
disease and the provision of appropriate diets for individuals and populations.
At the initiative of the Swiss Federal Office of Public Health a project was
started to develop a food composition table paying special attention to food
available in Switzerland.
As part of this project we develop software for data acquisition and compilation, data validation and quality control and calculating recipes of typical Swiss products.
A CD with 900 foods and products providing information about energy, water and 34 different substances has been released in the Spring of 2003. Currently we are completing an online version of the food composition database.
Figure 2
Query result of the online Swiss Food Composition Database
![]()
Data quality
Collection-based research follows a simple but power-ful paradigm: the person
who collects data may not be the one who interprets these data.
Besides facilitating the dissemination of information, this mode of operation also opens the scientific process to examination. The trend is unavoidable because the next generation of scientists is growing up with the internet.
This development inevitably leads to the question "how good are data collections?" In other words, how can a collection-based researcher evaluate data quality?
Many large and small corporations have initiated Continuous Quality Improvement (CQI) programs to be able to monitor organisational business processes. This need of industry to maintain data of high quality has led to many research efforts such as MIT's Total Data Quality Management (TDQM) program.
Furthermore, risk management enterprises are increa-singly interested in data quality management, parti-cularly with respect to data that closely relates to human health (e.g. nutrition, medication).
In a separate project we investigate methods to manage information about data quality for the Swiss Food Composition Database, a typical application for collection based research.
Figure 3
Cause and effect diagram illustrating the quality chain of food composition
data production
These topics are also related to research in Large Scientific Databases.
![]()
Multidimensional
data structures
With the goal to develop novel data
structures to manage multidimensional parameter data, we concentrate efforts
on two fronts:
Multivariate
visualization
We investigate two questions that
arise with the visualization of scientifc data (not to be confused with
scientific visualization):
new!!
![]() The
VisuLab®, V4.0. A new development of the VisuLab designed as an add-in
for MS Excel 2000, XP, 2003.
The
VisuLab®, V4.0. A new development of the VisuLab designed as an add-in
for MS Excel 2000, XP, 2003.
![]() The
VisuLab®, V2.1, (available via anonymous ftp)
The ftp site has been updated on 20. July 1998 (read the readme2 file).
The
VisuLab®, V2.1, (available via anonymous ftp)
The ftp site has been updated on 20. July 1998 (read the readme2 file).
Take a look at a sample screen image of the VisuLab.
If
the VisuLab has raised your interest in Parallel Coordinates, you might want
to visit Al Inselberg's homepage.
![]()
| Comments to: | |
| Oct., 2007 |