Nächste Seite: 7.4 Plots mit zwei Aufwärts: 7. Graphik in MATLAB Vorherige Seite: 7.2.1 Aufgaben Inhalt
Der MATLAB-Befehl subplot ermöglicht es, eine gewisse Zahl von
Plots in einer einzigen Figur darzustellen. Wenn subplot(mnp)
resp. subplot(m,n,p) eigetippt wird, so wird der ![]() -te Plot
in einem
-te Plot
in einem ![]() -mal-
-mal-![]() - Array von Plots angewählt. Nachfolgend können
die graphischen Befehle normal eingegeben werden.
Die Befehlsfolge
- Array von Plots angewählt. Nachfolgend können
die graphischen Befehle normal eingegeben werden.
Die Befehlsfolge
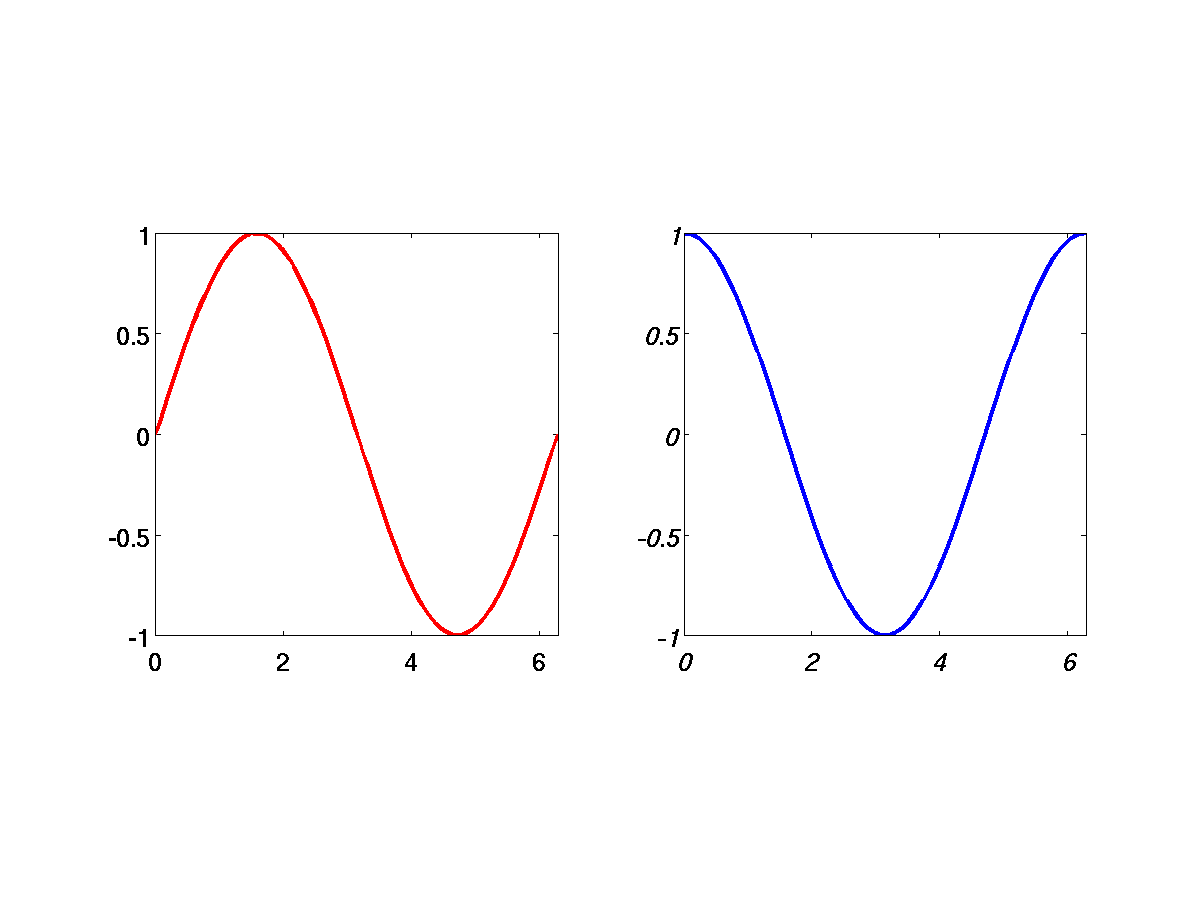
    >> subplot(1,2,1), plot(x,sin(x),'Linewidth',2,'Color','red')
    >> axis([0,2*pi,-1,1]), axis square
    >> set(gca,'FontSize',12,'FontWeight','bold')
    >> subplot(1,2,2), plot(x,cos(x),'Linewidth',2,'Color','blue')
    >> axis([0,2*pi,-1,1]), axis square
    >> set(gca,'FontSize',12,'FontWeight','bold','Fontangle','Oblique')
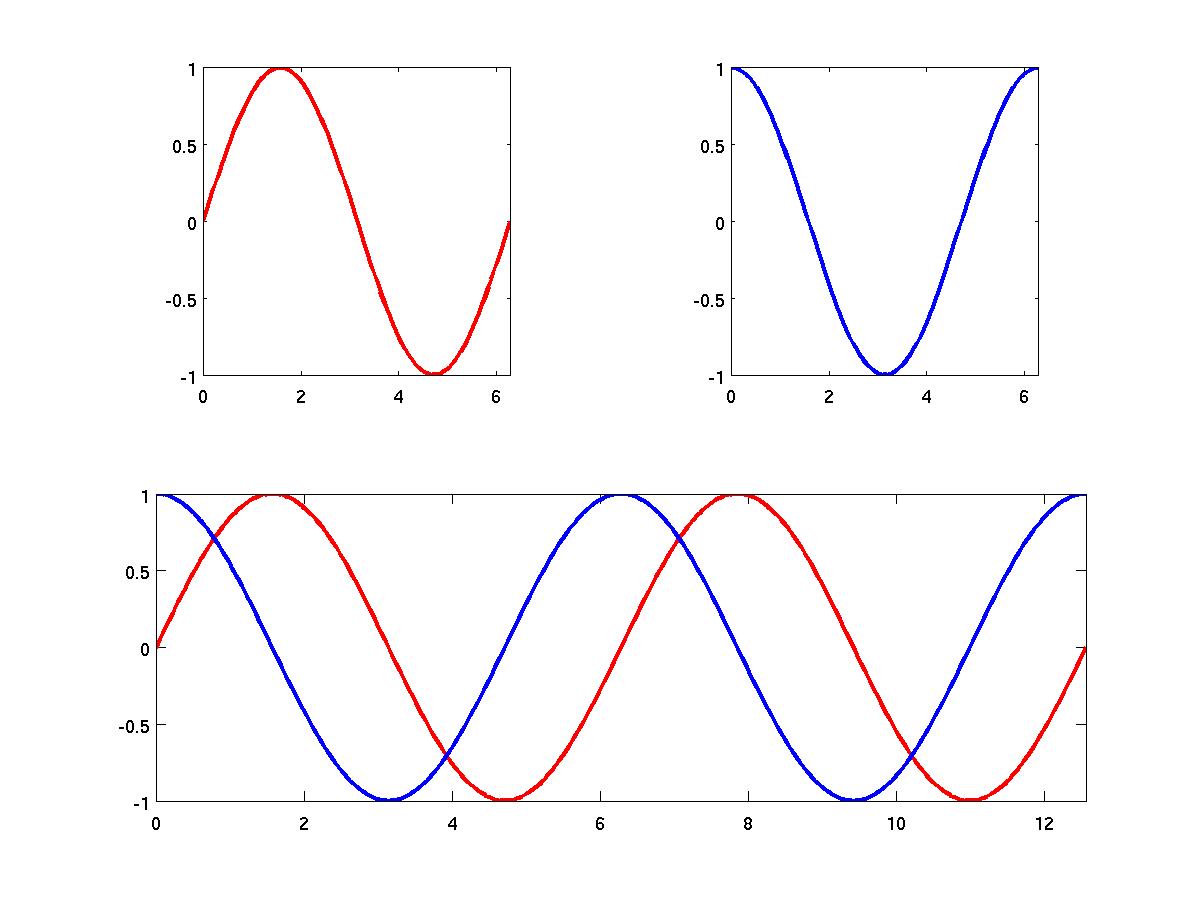
führt zum Bild in Abb. 7.4. Ein weiteres Beispiel ist
    >> subplot(2,2,1), plot(x,sin(x),'Color','red')
    >> axis([0,2*pi,-1,1]), axis square
    >> subplot(2,2,2), plot(x,cos(x),'Linewidth',2,'Color','blue')
    >> axis([0,2*pi,-1,1]), axis square
    >> subplot(2,2,3:4) fplot(@(x)[sin(x),cos(x)],[0,4*pi])
was zum Bild in Abb. 7.5 führt.